What percentage of American workers are unionized?

January 24, 2023

Place your bet before reading on…
=============

Some interesting numbers from the most recent BLS “Union Members Summary”:

> The union membership rate — the percent of wage and salary workers who were members of unions — was 10.1% in 2022

That’s down slightly  from the 10.3% in 2021 … but half the 20.1% rate in 1983 — the first year where comparable union data was collected and reported

=====

> In 2022, 30% of the 14.3 million union members lived in just two states: California (2.6 million) and New York (1.7 million).

=====

> The union membership rate of public-sector workers (33.1%) is more than five times higher than the 6% rate for private-sector workers.

=====

> The highest unionization rates in 2022 were 34.6% in “protective service occupations (think: police & fire) and 33.7% in education (think: public school teachers)

=====

> Among full-time wage and salary workers, union members had median usual weekly earnings 18% higher than nonunion workers ($1,216 to $1,029).

But, those wage differentials are largely attributable to the concentration of union workers in high cost-of-living states (i.e. CA, NY and NJ).

=============

For the record, I pegged the unionization rate way high at 20% to 25%.

How did you do?


The UK’s “new normal” in healthcare…

January 19, 2023

“Private pay” to the (partial) rescue.
=============

Recently, a friend’s family member — a UK citizen, living in London — needed open heart surgery.

Rather than waiting in the months (or years) long National Health Service queue, he understandably opted to “private pay” for surgery at the Cleveland Clinic in London.

As the Cleveland Clinic – London promotes on it’s web site:

Some medical issues just can’t wait, especially when they’re affecting your quality of life.

At Cleveland Clinic London, you have the freedom to self-pay or pay through private medical insurance or a sponsorship.

This gives you access to prompt care when you need it the most.

With that case top-of-mind, a WSJ Editorial caught my eye: Britain’s National Health Service Meltdown.

Here’s an excerpt from the editorial…

=============

The Situation:

The UK is in the midst of another winter of healthcare misery.

The National Health Service’s winter crisis has become an annual tradition, but this year’s troubles for the free-at-point-of-service system are significantly worse.

The “new normal” winter wave of flu, Covid and other respiratory ailments is swamping hospitals and doctors’ offices already coping with a backlog of patients awaiting tests and treatments deferred by Covid lockdowns.

Waiting times for ambulances for the most serious calls are getting longer, with the average response time — targeted at 7 minutes — reaching over 10 minutes.

Once patients reach the emergency room, 35% now face waits above four hours between a decision to admit and transfer to an appropriate bed for treatment, the worst performance since 2010.

Some 7.2 million non-emergency patients are waiting prescribed treatment to start.

Of those, over 40% (2.9 million) have been waiting more than 18 weeks.

The NHS considers itself a success if it starts treatment within that four-month window.

By some estimates, NHS delays may be contributing to the 1,000 weekly excess deaths in recent weeks —deaths above the normal average level.

============

The (partial) remedy

One sign of the severity of this year’s crisis is the rise of private and semi-private healthcare.

An increasing number of Britons who can afford it buy private health insurance, which generally requires them to use the NHS for routine matters but lets them skip queues for specialist care, physical therapy and the like.

Some NHS hospitals are even offering patients the option to pay out-of-pocket for diagnostics or treatments to skip NHS queues.

Some NHS hospitals with record waiting lists are promoting “quick and easy” private healthcare services at their own hospitals, offering patients the chance to jump year-long queues … for an additional private pay fee.

For example, the Guardian cites the case of a woman who was told that she’d have to wait two years for surgery via the NHS or can see the same surgeon in the same hospital and be treated in two weeks for £1,200.

Hospitals are offering hip replacements from £10,000, cataract surgery for £2,200 and hernia repairs for £2,500. MRI scans are offered for between £300 and £400.

One lady who paid £350 for an MRI scan reported that “There were posters on the walls stating times for the return of results: three days for private, three weeks for NHS.”

=============

The WSJ’s conclusion

“The U.S. suffers a chronic problem of healthcare financing but not of health-care delivery.

Britain shows that with single-payer you end up with both.”

I agree with the latter conclusion, but based on some recent experiences, I’m not so sure that I agree with the latter.

These days, almost everybody I know (myself included) is  now or has recently been sick.

And, with only a few exceptions, most have been frustrated by the long leads required to see their primary care doctor … or, god forbid, specialists.

==============

More to come on that subject…

Need a chuckle?

January 17, 2023

Good news: Darwin is alive and well!
==============

Maybe true, maybe not.

Don’t quibble, just laugh…
=============

[San Jose Mercury News]:
An unidentified man, using a shotgun like a club to break a former girlfriend’s windshield, accidentally shot himself to death when the gun discharged, blowing a hole in his gut.

=============

[Kalamazoo Gazette]:
James Burns, 34, (a mechanic) of Alamo, MI, was killed as he was trying to repair what police describe as a “farm-type truck.”

Burns got a friend to drive the truck on a highway while Burns hung underneath so that he could ascertain the source of a troubling noise.

Burns’ clothes caught on something, however, and the other man found Burns “wrapped in the drive shaft.”

==============

[Hickory Daily Record]:
Ken Charles Barger, 47, accidentally shot himself to death in December in Newton, NC.

Awakening to the sound of a ringing telephone beside his bed, he reached for the phone but grabbed instead a Smith & Wesson 38 Special, which discharged when he drew it to his ear.

==============

[UPI, Toronto]:
Police said a lawyer demonstrating the safety of windows in a downtown Toronto skyscraper crashed through a pane with his shoulder and plunged 24 floors to his death.

A police spokesman said Garry Hoy, 39, fell into the courtyard of the Toronto Dominion Bank Tower early Friday evening as he was explaining the strength of the buildings windows to visiting law students.

Hoy previously has conducted demonstrations of window strength according to police reports.

Peter Lawson, managing partner of the firm Holden Day Wilson, told the Toronto Sun newspaper that Hoy was “one of the best and brightest” members of the 200-man association.

A person has to wonder what the dimmer members of this law firm are like.

==============

[The News of the Weird]:
Michael Anderson Godwin had spent several years awaiting South Carolina’s electric chair on a murder conviction before having his sentence reduced to life in prison.

While sitting on a metal toilet in his cell attempting to fix his small TV set, he bit into a wire and was electrocuted.

==============

[The Indianapolis Star]:
A Dunkirk, IN man, using a cigarette lighter to check the barrel of a muzzleloader, was killed Monday night when the weapon discharged in his face, sheriff’s investigators said.

Gregory David Pryor, 19,  was cleaning a 54-caliber muzzle-loader that had not been firing properly.

He was using the lighter to look into the barrel when the gunpowder ignited.

==============

And the winner is …

==============

Read the rest of this entry »

The worst business jargon…

January 10, 2023

What’s your pick?
==============

Citing the obvious …

“Business jargon is so ubiquitous and most everyone is guilty of using it, yet it’s also pretty widely disliked.”

As a public service, a couple of Fast Company editors “whittled an extensive lexicon of bad office jargon down to 16 widely used terms and phrases.”

Pick your favorite from their Top 16 list:

  1. Alignment
  2. Bandwidth
  3. Blue sky (ideas)
  4. Boots on the ground
  5. Circle back
  6. Disrupt
  7. Double click (on an idea)
  8. Empower
  9. Growth hacking
  10. Leverage
  11. Low hanging fruit
  12. Move the needle
  13. Synergy
  14. Take it offline
  15. Think outside the box
  16. Thought leadership

==============

To pick the worst of the worst, the East Company editors opined:

    • Some terms like “thought leader” and “empower” struck a more irritating nerve with us because we see them overused in pitches.
    • Others like “boots on the ground,” “double click,” and “growth hacking” aren’t ones that we have personally encountered in our daily office life, they are annoying for their connotations and sound.
    • Some like “circle back” and “move the needle” may be tired and overused, but serve as a useful and concise way to convey meaning.
    • Others, like “synergy” and “disrupt” have been used so much they feel dated and meaningless.

Their winner: the oldie, but not goody: SYNERGY … the prospects of  growing businesses and cutting costs by combining organizations.  Too often,, those benefits are “pie in the sky” and aren’t realized.

Oops, did I just add more jargon to the list?

==============

P.S. I’d also add to the list “reimagine” and “root causes” .. to me, these terms connote “don’t expect anything to actually happen”.

What would you add to the list?

The courses are too damned hard!

January 6, 2023

So says 87% of college students.
=============

To get a better understanding of how students perceive the difficulty of  their courses and to determine how students respond to being enrolled in a challenging class, Intelligent.com surveyed 1,000 current 4-year college students.

Here’s what they found:

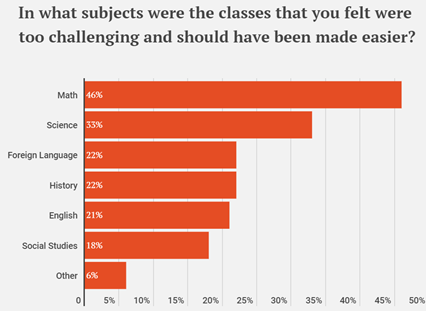
> 87% of college students say some or many professors make classes too difficult.

> Specifically, 13% said none of their course were too difficult, 21% said one course was too difficult, 54% a few courses were too difficult, 13% said that most or all of there courses were unnecessarily difficult.

> Math and Science are the courses that are most frequently cited as unnecessarily difficult.

image

And, how are students responding to the curricular challenges that they encounter?

> 17% dropped a class they thought was too difficult.

> 69% of students say they respond (to difficult courses) by asking a professor or classmate for help or by studying more

> To that end,  64% say they put ‘a lot’ of effort into their classes …

> But, of the 64% who say they put in a lot of effort, 1/3  admit that they spend less than 5 hours a week studying and on homework … said differently, that’s about an hour per weekday

Cheating, blame shifting and grousing are flavors de jour:

> 31% have cheated in order to get a better grade

> About 1 in 10 students filed a formal complaint that at least one course or professor is too hard

> 2/3s  say the professor should be forced to make a class easier

> 38% of students have asked a professor to change their grade

> Nearly half (47%) of college students want to throw out the traditional grading system and replace it with a pass/fail grading system.

Here’s the kicker: despite their “challenges” at the undergrad level…

> 81% say it’s likely they’ll pursue a graduate degree; 25% in business, 14% computer science, and 13% medicine.

As if grad school is going to be a cake walk…

YIPES!

Update: If the earth is warming why isn’t Baltimore?

January 3, 2023

With the December data in, the plot thickens….
===============

Today, let’s update the analysis that I’ve been reporting …

Like much of the U.S., the Baltimore area (where I live) endured an apparent heatwave this summer.

It was hot enough that, even I, momentarily thought: “Maybe the earth really is warming.”

Then, I started looking harder at my monthly electricity bills from BGE (Baltimore Gas & Electric).

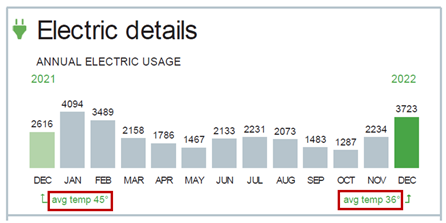
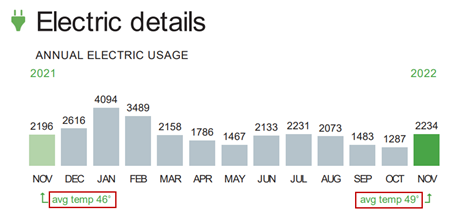
Besides usage info, BGE reports the average monthly temperature, for the current and prior years (the red boxes below).

We previously reported in the past couple of months that year-to-date temperatures in the Baltimore area have been a couple of degrees colder than those in the prior couple of years.

Well, I just got my December bill and guess what.

Average temperatures in the Baltimore area in December were 9 degrees COLDER than last year.

image

The average December temperature in Baltimore this year was 36 degrees …  9 degrees COLDER than last year’s 45 degrees.

==============

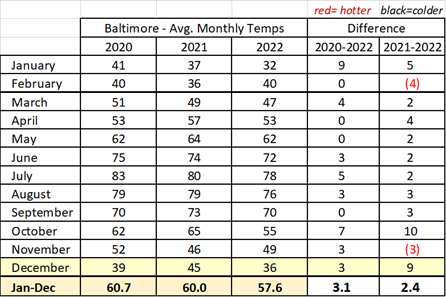
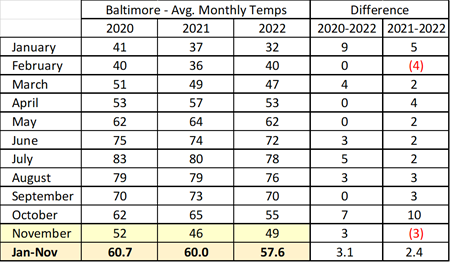
So, for the full year 2022, average temperatures in Baltimore were 2.4 degrees colder than they were in 2021 … and 3.1 degrees colder than than they were in 2020.

image

Note that 8 of the 12 average monthly temperatures were colder in 2022 than they were in 2020 … the other 4 months were tied.

Only 2 months in 2022 (February and November) were hotter in 2022 than they were in 2021 … 10 of 12 months were colder.

Hmmm.

==============

For the record: My electricity usage only increased by 1% from 2021 to 2022 … but my total electrical bill went up by 13.4% …. thanks to a roughly 12% increase in electricity prices.

Thanks, Joe.

The best New Year’s Eve “Ball Drop” … GUARANTEED

January 1, 2023

From the HomaFiles archives…

Last year, one of the teachers at Holy Trinity School (where 2 of my grandkids go) became an internet star.

Kathleen Fitzpatrick (aka. Ms. Fitz), became a viral internet sensation by sinking a full court shot … on the school’s playground … in front of her cheering students.

ESPN “re-purposed” the video clip for New Year’s Eve.

Totally AWESOME! Well worth watching…

image

Happy New Year!

December 31, 2022

Let’s all count our blessings and do our part to make 2023 a joyous year…

image

Merry Christmas … 45 Lessons in Life

December 24, 2022

Merry Christmas, Happy Hanukkah and HAPPY NEW YEAR to all !

This short video was sent to me by a friend a couple of years ago.

It really resonated with me, so continuing a holiday tradition, I like to share it at Christmas time.

back with you after the New Year

* * * * *

click to view (best with audio on)
image

Factoid: 1 of every 5 online purchases is returned.

December 22, 2022

…. and about 1 in 10 of them are fraudulent.
=============

Recently, I returned an item that I had I bought on Amazon.

That’s a rare event for me, so I was pleasantly surprised that the process was relatively hassle-free … it took a couple of minutes to get Amazon’s return authorization … it was a short drive to a UPS store … the transaction at the UPS store took about a minute … my credit card was credited within a couple of days.

A couple of things struck me during the process:

> Most of the people in the UPS store were making merchandise returns — apparently, that’s become a big business for UPS

> Most of the returns were literally thrown into a big box … unpackaged and without paperwork … what happens to that stuff

Hmm
============

With that experience fresh in mind, I happened to come across a CNBC article channeling some data from a National Retail Federation report.

image

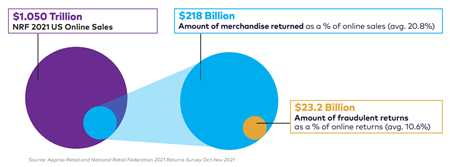
> In 2021, the  US Retail Industry reported just over $1 Trillion in online sales

> Of the $1 Trillion, $218 Billion (20.8%) was returned for credit

> Of the $218 Billion, $23.2 Billion (10.6%)  were fraudulent returns

> The $23.2 Billion of fraudulent returns consisted mostly of:

  • “Wardrobing” … wearing or using an item for one occasion and then returning it
  • Returning items that had been shoplifted, stolen, purchased from another retailer or purchased fraudulently (e.g. on stolen credit cards)
  • Resulting from employee fraud or employee collusion with bad actors

Not surprising, a big issue for Amazon and other retailers is what to do with the returns.

The cost of transporting, receiving, sorting, inspecting, repackaging and restocking returns is a costly logistical nightmare … especially for relatively low value items.

So, except for higher priced merchandise, the returns are simply thrown into a big box (as I experienced at the UPS store) … and the box of miscellaneous stuff is sold to scavenger resellers at pennies on the dollar.

See the CNBC article for the story of one couple who scavenges and resells returns.


Presto: logistical problem solved…

==============

P.S. Don’t feel too sorry for Amazon and other retailers.  Based on my experience, the retailers just charge the cost of the returns back to the manufacturers who treat it as a cost of doing business.

It used to irk me when retailers would promote their “easy returns – no questions asked” policies, knowing that my company (not the retailer) would be funding the retailer’s largess.

So, which political campaigns did FTX bankroll?

December 16, 2022

That’s what I’ve been wondering.
==============

The MSM headlines say that FTX-SBF supported both Democratic and GOP political candidates and causes.

Really?

Bankman-Fried has claimed that he gave just as much to GOP causes. Source

Really?

Well. according to WaPo :

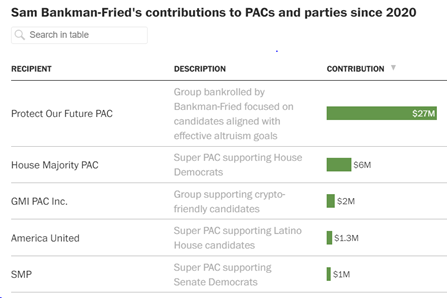
Sam Bankman-Fried, the disgraced founder of the cryptocurrency exchange FTX, was a prolific political donor, pumping about $40 million this cycle alone into campaign committees and other groups, mostly aligned with Democrats.

Hmm. Mostly to Democrats.

What constitutes “mostly”?

WaPo dug through Federal campaign filings, to catalog SBF’s political largesse.

Below are the entities that got more than $1 million.

image

One PAC — Protect Our Future — got $27 million … 67% of the $40 million.

According to Politico:

Protect Our Future is a Democratic political action committee aiming to support “lawmakers who play the long game on policymaking in areas like pandemic preparedness and planning.”

OK, that alone blows SBF’s claim of statistically significant bipartisan giving.

Going down the list of big beneficiaries, the GMI PAC — which got $2 million — says it supports crypto-friendly candidates.

Maybe some of the GMI-supported candidates were Republicans…

The rest of the Top 5 list are clearly Dem-aligned.

And , in aggregate, the Top 5 account for $37.3 million… 93% of the $40 million.

Bottom line: Practically all of SBF’s donations went to Democrats.

Not exactly a shocker…

Biden takes another victory lap.

December 15, 2022

Says his economic policies tamed inflation.
==============

I guess it’s not as bad as when he declared inflation was down to zero, but…

According to WaPo: “Biden is now seeking to reframe the economic narrative ahead of announcing his own reelection plans early next year”.

image

It’s cringe worthy when Joe declares that he’s got inflation under control.

Yep, the year over year rate of change has dropped from over 8% down to the mid 7s, but that’s hardly an end to the inflationary pressures that everybody is feeling.

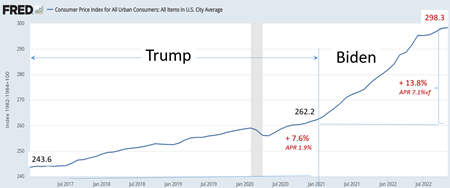
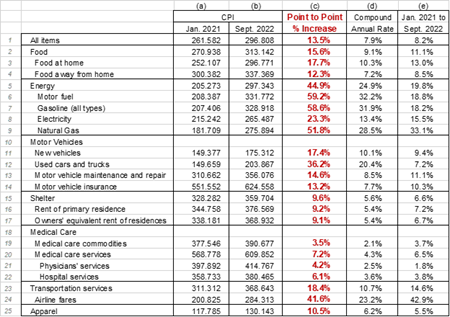
The number to focus on is 13.8% … that’s how much prices have gone up since Biden was inaugurated.

image

==============

Diving into the numbers:

> When Biden was inaugurated, the CPI was 262.2 … in November, it was 298.3 … that’s a 13.8% increase over Biden’s 22-month term … on an annualized basis, that’s a 7.1% APR

> In comparison: When Trump was inaugurated, the CPI was 243.6 … when he left office in Jan. 2021, it was 262.2 … that’s a 7.6% increase over Trump’s 4-year term … on an annualized basis, that’s a 1.9% APR

> Cutting the numbers a different way: From Trump’s inauguration date to Nov. 2022 (almost 6 years), the CPI increased 21.3% … 1/3 of the increase occurred during Trump’s run (at a 1.85% APR, which is roughly what the Fed targets for the U.S. long term rate) … and 2/3s of the increase has hit during Biden’s reign (2 years at a 7.1% APR)

image

=============

Think about this:

> If inflation had continued at Trump’s APR ( a 1.85% APR), the CPI would be about 270 today … we’d be seeing prices about 10% lower than they are today.

===========

Ask yourself a variant of Ronald Reagan’s “cut to the chase” question:

Is your pantry, wallet, IRA, 401K or 529s better off today than they were 22 months ago?

A Star is Rising!

December 13, 2022

OK, I’m a doting grandfather and may be getting ahead of myself, but…

A couple of years ago, in grandfatherly fashion, I gushed with pride that our granddaughter Maddie (then 7 years old) debuted as a “Dancing Bee” in The Washington Ballet’s performance of the Nutcracker.

See A Star is Born! to trace Maddie’s journey from toddler dancer to dancing with The Washington Ballet.

image

============

Now, let’s fast forward to this year.

Maddie just celebrated her 10th birthday … and look at her now:

image

Again, it’s The Washington Ballet’s Christmas presentation of the Nutcracker.

Maddie was on stage for most of the first act … and even got to dance a duet with one of the show’s adult stars.

Wow.

What’s next, a role dancing as the Sugar Plum Fairy?

Maybe someday…

Viva la diva…

We’re proud of you, Maddie!

Sinema declares independence … bolts from Democratic Party

December 9, 2022

Will Manchin be next?
=============

Headlining the NYT and WSJ today:

“Senator Kyrsten Sinema of Arizona is leaving the Democratic Party and registering as an independent”

Her motivation: Her “centrist approach pitted her against parts of President Biden’s agenda and made her the target of Democratic activists.”

Her rationale: “Writing in The Arizona Republic, she said that she had “never fit perfectly in either national party” and that the “loudest, most extreme voices continue to drive each party toward the fringes.”

=======

Sinema ruled out caucusing with the GOP … and hasn’t decided whether or not she’ll caucus with the Dems.

My question: Is Sinema’s move an outlier or a trigger for a trend?

Will Manchin will follow suit and declare independence? Or, Tester?

From the GOP, will Romney, Murkowski and Collins declare their independence?

Maybe a separate Independent’s caucus will emerge.

That would make things interesting.

But, it’s way more likely that Sinema is just an outlier.

This will be interesting to watch…

More: If the earth is warming why isn’t Baltimore?

December 8, 2022

A reader offered up a simple explanation … and, prompted me to do some additional analysis.

My conclusion may surprise you.
=============

Previously, I challenged readers to square this circle:

  • If the data shows that my average   local temperatures in Baltimore have dropped about 3 degrees from 2 years ago (and one year ago) — why should I believe (with “settled science certainty”) that the earth will be a degree or two hotter 50 or 100 years from now if I keep driving my SUV?

A reader offered up a simple explanation: 2020 and 2021 were historically hot years … and, if I looked deeper back in history I’d see that 2022 temperatures are consistent with a warming trend.

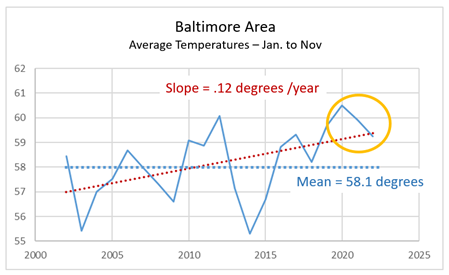
So, I pulled some more historical data from the NWS web site going back 20 years (for the Baltimore area).

image_thumb11

Here’s what I found for the January to November periods in each year:

> Temperatures bounce around a lot from year to year …  within about a 5 degree range from 55.3 (in 2014) to 60.5 (in 2020)

> There have been a couple of notable temperature troughs …     55.4 in 2003 and 55.3 in 2014

> The peaks do seem to be getting higher …  from 58.7 in 2006 … to 60.1 in 2012 …. to 60.5 in 2020 … but they are well spaced (rather than coming in runs)

> 2020 was, in fact, the hottest of the 20 years (60.5 degrees) …  but only slightly hotter than the 60.1 degrees registered 10 years ago in 2012 … hmm

> 2021 was also hot (59.9 degrees) but that temp is down from 2020 … and colder than 2012.

> The past 7 years (including 2022) have been hotter than the 20 year average (58.1 degrees) … and the last 10 of the 20 years have been about 1/2 degree hotter than the first 10 years.

> Based on a simple linear regression, it would appear that Baltimore area temperature averages have been increasing about 1 degree every 10 years … but, again, with high year-to-year variability.

=============

Bottom line: The data suggests that it is getting hotter in Baltimore …. but I’m waiting for some more data to come in.

Maybe we’re in a cyclical cooling phase from the 2020 hot temperatures … or maybe this part of the earth really is warming.

Stay tuned…

Nov. Update: If the earth is warming why isn’t Baltimore?

December 6, 2022

That’s a question I’ve been asking over the past couple of months.
===============

Today, let’s update the analysis that I’ve been reporting …

Like much of the U.S., the Baltimore area (where I live) endured an apparent heatwave this summer.

It was hot enough that, even I, momentarily thought: “Maybe the earth really is warming.”

Then, I started looking harder at my monthly electricity bills from BGE (Baltimore Gas & Electric).

Besides usage info, BGE reports the average monthly temperature, for the current and prior years (the red boxes below).

We previously reported in the past couple of months that year-to-date temperatures in the Baltimore area have been a couple of degrees colder than those in the prior couple of years.

Well, I just got my November bill and guess what.

The 8 month run of colder average monthly temperatures (versus last year) was finally broken.….

image

The average November temperature in Baltimore this year was 49 degrees …  3 degrees hotter than last year’s 46 degrees.

image

But, the November temp this year (49 degrees)  was still 3 degrees  colder than November 2 years ago (52 degrees) … and, the 11 month average (January to November) for 2022 was still 2.4 degrees colder than 2021 …. and 3.1 degrees colder than 2020.

Hmmm.

==============

Previously, I challenged readers to square this circle:

  • If the data shows that my average   local temperatures have dropped about 3 degrees from 2 years ago (and one year ago) — why should I believe (with “settled science certainty”) that the earth will be a degree or two hotter 50 or 100 years from now if I keep driving my SUV?

A reader offered up a simple explanation: 2020 and 2021 were historically hot years … and, if I looked deeper in history I’d see that 2022 temperatures are consistent with a warming trend.

That prompted me to do some further digging.

I’ll present my findings in a subsequent post…

“The flight from merit continues across America”

December 1, 2022

That’s what the WSJ called the ABA’s pending move to eliminate the LSAT.
==============

Buried in the T-Day news was this tidbit…

The American Bar Association (ABA) — which accredits law schools — is planning to end the requirement that prospective law students take the Law School Admission Test (LSAT).

============

Background

For decades, law schools considered an applicant’s LSAT score along with the standard law school application information,  GPA, letters of recommendation and an applicant’s personal statement.

The LSAT is administered in a controlled testing environment (to minimize the likelihood of cheating) and scores test takers quantitatively (i.e. a numerical score).

Some (many? most?) top law schools, weight the LSAT score just as heavily (or even more heavily than) than an applicant’s GPA (thanks to grade inflation and incomparability across UG schools) … and recommendation letters (which are selectively prone to one-sided puffery).

There are four main LSAT sections :

  • Logical Reasoning (also known as Arguments)
  • Analytical Reasoning (also known as Logic Games)
  • Reading Comprehension
  • Writing Sample (also known as “The Essay”)

Pretty basic competencies for law students and most lawyering, right?

=============

Well, the LSAT has been in the crosshairs for the past few years.

Why?

The legal profession has long been criticized for a lack of women and people of color in its top ranks.

So, the debate centers on whether the tests help or hurt diversity in admissions.

On one hand, LSAT opponents argue that the test disadvantages certain minority groups, is a tenuous predictor of law school success and ignores “soft“ personal skills t(that many lawyers seem to lack).

”Law incorporates a range of skills, from logical thinking to business development and effective presentation that can’t all be predicted on a test.” WSJ

“Detractors also object to the LSAT because affluent students often pay thousands of dollars to prepare for the test that is supposed to predict their first-year law school performance.” WSJ

Proponents argue that eliminating the test would increasing the influence of subjectivity (vs. objectivity) in the review process by placing greater emphasis on often incomparable GPAs and slanted recommendations.

To quell the debate, the ABA is intending to make the LSAT “optional” rather than “recommended” or “required”.

In a quick survey of law schools done by Kaplan (a test prep company), about half said that they would opt to keep requiring the test … about half said the were undecided and only a couple said that they would ditch the LSAT.

In other words, the ABA is simply tossing the hot potato to the individual schools, in effect, letting the market decide..

It’ll be interesting to watch how this one sorts out…

Home Alone … it’s not just Kevin McCallister!

November 29, 2022

Over the T-Day weekend, we watched the movie classic Home Alone with grandkids …

… or, as the 4-year-old kept calling it “Provolone”

So, the phrase “Home Alone” was front-of-mind for me … so the below WaPo chart caught my eye.

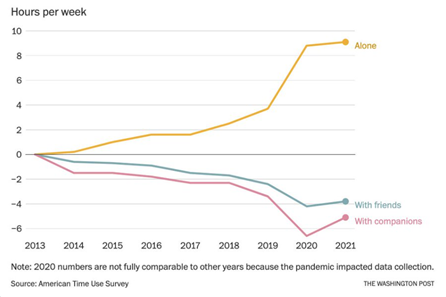
The data is from the BLS’ American Time Use Survey (ATUS) measures the amount of time people spend doing various activities, such as paid work, childcare, volunteering, and socializing.

In the last category “socializing”, a stark trend occurred”:

Of course, during the Covid lockdown period, people isolated themselves more, i.e. “time alone” spiked.

Pre-Covid, folks were spending about 2 hours a week alone.

That increased to 10 hours per week … and has stayed there post-lockdowns.

Not exactly hermit territory, but statistically significant.

image

Social behaviorists hypothesize that social relationships were weakened or broken during Covid … and wonder if they’ll be restored over time … or whether less socialization is a new normal.

If it is a new normal, psychologists warn of an apparent correlated trend in anxiety, depression and aggression.

WaPo’s observes:

You can help reverse these trends today without waiting for the researchers and policymakers to figure it all out.”

What to do?

  • Take advantage of the holiday season … accept the invitations that are offered … and offer a few invites yourself.
  • Be proactive and reach out to rekindle relationships that may have wither a bit during Covid.

Good advice.

The whole WaPo article is worth reading.

===============

P.S. In the movie Home Alone, Kevin McCallister (played by Macaulay Culkin) was a young boy whose parents inadvertently left him behind when they took a trip to Paris.  Chaos ensued.

Happy Thanksgiving!

November 23, 2022

It has been a tough couple of years.

So, it’s a good time to focus on the many reasons we still have to be thankful.

image

Another remote learning casualty: attractive females’ grades … say, what?

November 22, 2022

Here’s one that you might not have seen coming…

According to economic researchers in Sweden:

During the pandemic, as education moved online following the onset of the pandemic, the grades of attractive female students deteriorated. Source

Hmmm…

=============

Maybe this is something that we should have expected.

In a long ago HomaFiles post, we asked (and answered) the question:

Do better looking students get better grades?

To answer the question, Prof Robert Kaplan of San Diego State University conducted an experiment:

Faculty subjects were asked to grade an essay written by a student.

A photograph of the student was attached to the essay.

The grade given for the essay correlated strongly with a subjective attractiveness scale evaluated by other judges.

What is interesting is that all the subjects received the exact same essay, and the photograph attached to it was randomly assigned.

Bottom line: Physical attractiveness effects grading

Here’s what’s going on …

=====

According to Douglas Hubbard in “Measure Anything”

This is an example of the so-called “halo effect”

If people first see one attribute that predisposes them to favor or disfavor one alternative, they are more likely to interpret additional subsequent information in a way that supports their conclusion, regardless of what the additional information is.

For example, if you initially have a positive impression of a person, you are likely to interpret additional information about that person in a positive light (the halo effect).

Likewise, an initially negative impression has the opposite effect (the “horns effect”).

This effect occurs even when the initially perceived positive or negative attribute should be unrelated to subsequent evaluations.

For the  most memorable example of the halo effect see Biases: The “halo effect” … rock on, sister!

Be sure to watch the video … it’s priceless.

=====

So what?

Several studies have coined the correlation between attractiveness and grades to be a “beauty premium”.

It accrues when classes are held in person … but losses some of its sway in a zoom call.

It’s as simple as that…

More re: Covid learning loss

November 21, 2022

More research calibrates the problem.
=============

We previously posted that…

According to The Nation’s Report Card the pandemic school shutdowns took a near catastrophic toll … especially in math.

Pre-Covid, over 42% of 4th graders were considered proficient in math; that percentage slid to  36% during the Covid shut downs.

Similarly, pre-Covid, over 34% of 8th graders were considered proficient in math; that percentage slid to 26% during the Covid shut downs.

All of those numbers are pretty dismal.

=============

Moving the ball forward…

Researchers at Harvard and Stanford used the latest The Nation’s Report Card results to analyze the achievement drop in different school districts nationwide. Source: WSJ

As expected, there was a correlation between learning loss and the length of school shutdowns.

But, the learning loss was far greater than expected in poorer school districts (think: urban public school districts) than in better-to-do school districts (think: suburban public & private schools).

Said differently, evidence confirmed that poor children disproportionately suffered from pandemic-era disruptions.

In (poor) districts where 69% or more of students received lunch subsidies, children lost the equivalent of two-thirds of a year of math between 2019 and 2022.

In comparison, in (richer) districts where only 39% or fewer got free or reduced lunch, students fell less than half a year behind.

A case on point:

Falls Church City Public Schools is the second-most affluent district in Virginia, with an average household income of nearly $147,000.

There students fell less than 0.3 of a grade level behind in math.

In Richmond City Public Schools, where 93% of students qualify for free or reduced lunch,  children fell 1.96 grade levels behind.

=============

My Takeaways

> Reconfirmation that learning loss from Covid shutdowns “statistically” significant … as “little” as about 1/2 year in “richer” districts … up to 2 years in “poorer” districts”

> Concern that, while some parents are supplementing the schools with tutoring, etc., I’m still having a hard time hearing about or seeing any substantial, broadscale catch-up programs in our schools.

=====

Geez, even our lowly #27 worldwide ranking in academics is at risk… there’s lip service … the problem sure doesn’t seem top of mind.

Will somebody please pass the crow?

November 18, 2022

About the election polls
=============

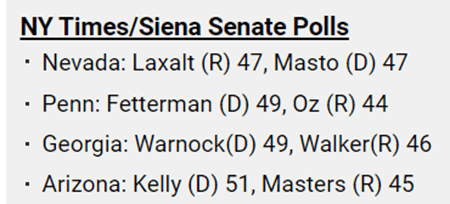
A week or so before the election, the NY Tomes published a poll in conjunction with its polling partner Sienna University.

The poll’s results were contrary to the red wave being reported by other big name polling outfits.

Like many, I dismissed the NYT-Sienna Poll as an outlier… after all, it was the Dem partisan New York Times.

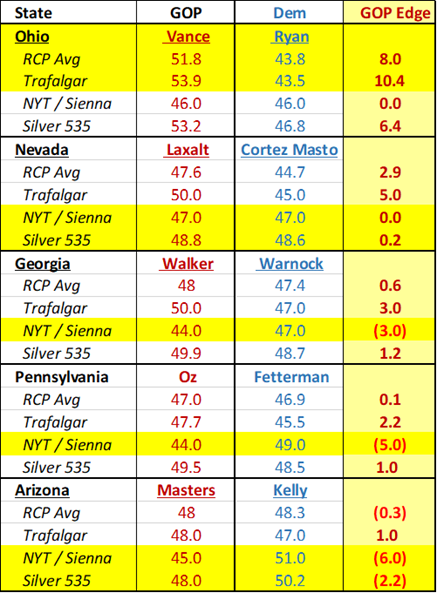
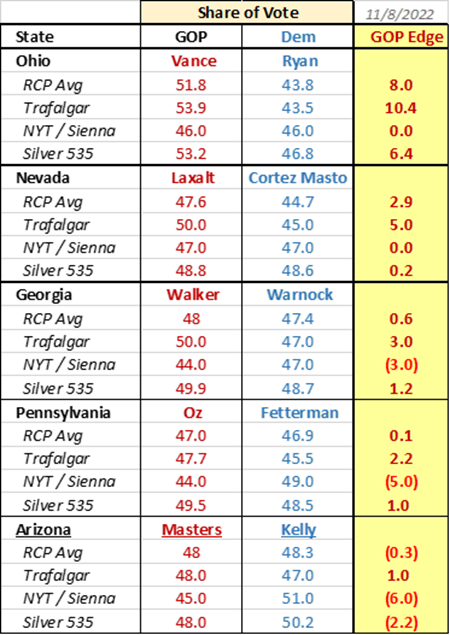
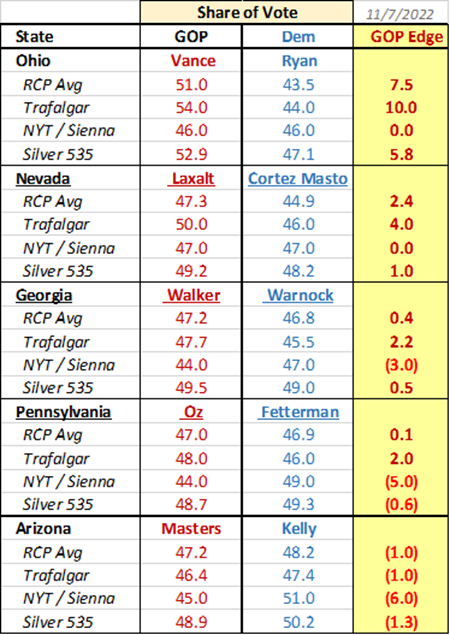
But, now that most of the dust has settled: The NYT-Sienna got all 4 of the most closely watched Senate races right.

Note: On the 5th — Ohio — NYT-Sienna pegged the race as a dead heat.

Not kinda right …  nearly perfectly right!

Their share of votes predictions were practically dead on the final results.

============

How does that compare to the other top name polling services?

> The RCP’s poll-of-polls and Silver 535 were close in Ohio … had Kelly in AZ … but mis-called winners in NV, GA and PA

> Trafalgar … was closest to the pin on Ohio … but miscalled winners in NV, GA, PA and AZ … OUCH!

> NYT-Sienna … called ties in OH and NV   … but were spot on the other 3 races.

image

My take: The NYT-Sienna poll was the clear winner this round.

Time to eat, so pass the crow to the other pollsters … and me, for buying into Trafalgar and the “wisdom of the (pollster) crowd”.

Oh well… better luck next time, right?

America’s political polarization in 4 charts …

November 16, 2022

It’s not new … and it’s not all Trump’s fault.
————–

It’s no secret that American politics has become increasingly – and maybe, irreversibly – polarized.

Biden lays it all off on Trump and his MAGA supporters. … totally ignoring the role that he (Biden) and Obama played.

Let’s look at some inconvenient facts and put them in perspective…

=========

Way back in 2014, Meet the Press host Chuck Todd observed:

Polarization is no longer just polluting the system — it’s paralyzing it.

The deepening divide between the right and the left has largely hollowed out the center of American politics.

Gone are the politicians who once occupied the large “middle” and the voters who once gravitated to them.

Todd’s observations were true then, and they’re true now.

=========

The Pew Research Center has tracked party identity and ideology for decades.

One way they do it is by scoring the Republicans and Democrats on a 10-item scale of political values.

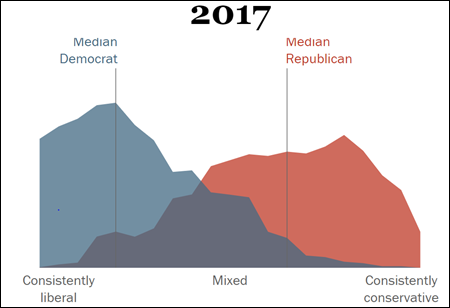
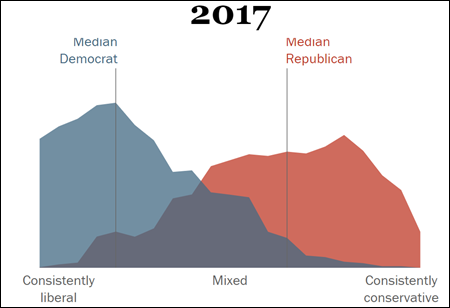
Based on the latest Pew data (from 2017, the latest Pew data I could find)), here’s where we stood:

image

=========

What the chart means …

Democrats cluster to the left, Republicans cluster to the right.

Less than 10 percent in each party overlaps ideologically with the other side.

That’s where we are.

How did we get here?

=======

Let’s add some historical perspective …

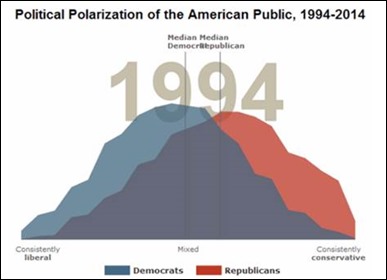
Back in to mid-90s, there was a divide, too, but the distance between the peaks was relatively small.

clip_image004

Put another way…

In 1994, a couple of years into the Clinton presidency, Pew found that 36 percent of Republicans were more liberal than the median Democrat … and 30% of Democrats were actually more conservative than the median Republican.

The blue and red curves pretty much blended together … with a big clump of folks overlapping in the center.

=========

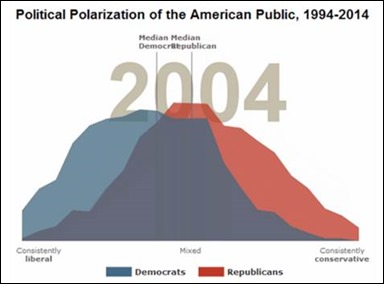
Then came the Bush years.

Many pundits claim that Bush forged the great divide.

But, the facts are to the contrary.

clip_image006

By midway through the Bush presidency, the ideological peaks had converged even closer.

The biggest area of the chart is the dark blue section … which indicates the a very middle of-the road America.

=========

Now, let’s advance the calendar and look at 2014.

By the 6th year of the Obama presidency, each side moved further to their extremes .

Less than 10 percent in each party overlapped ideologically with the other side.

Here’s where we were in 2014.

clip_image002[1]

=========

Now, let’s look at what happened between 2014 and 2017 (Pew’s latest survey)…

image

Note that the dark blue “middle of the road” has shrunk.

The red section flattened a bit … with more conservatives moving to the middle.

But, the light blue section has moved to the left (away from the middle) … with a peak moving further to the left.

The data only covers part of the first year of the Trump administration so, for the most part, it’s the legacy that Obama left for Trump.

Certainly, the polarization was amped up during the Trump years.

But, Biden may want to look in a mirror before he starts laying all the blame on Trump.

=============

P.S. I wonder why Pew stopped publishing this data and it’s cut-to-the-chase charts.

The right track – wrong track paradox.

November 14, 2022

A vast majority of Americans think the country is on the wrong track, but a slim majority voted for the status quo.

As one political pundit put it:

In my view, the strangest thing about the midterm election is how rigidly it preserved the status quo.

At a time when something like 70% of voters say we are on the wrong track, and explosive issues like crime, the cost of living and illegal immigration are roiling the electorate, voters nevertheless turned out for incumbents.

Are voters really that attached to the status quo?

Let’s drill down on that question…
==============

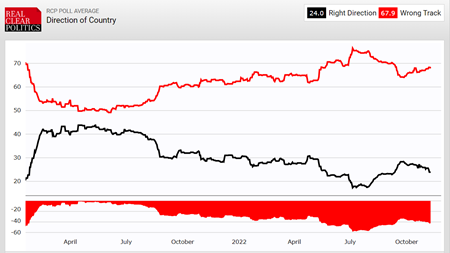
In the run-up to the 2022 midterm elections, much was made of right track – wrong track polling.

image

In round numbers, over 2/3s of Americans think the country is on the wrong track … the other 1/3 think the country is on the right track or have no opinion one way or another.

From that data alone, it was reasonable to expect that the election would usher in sweeping change.

But it didn’t.

How can that be?

Again, just isolating on the right track – wrong track measurement, the answer is simple…

Americans may agree that the country is on the right track … but they don’t agree on what constitutes a right track.

From 50,000 feet, it may be that half of the wrong tracker think that the current track is too progressive … and half think that the current direction is too conservative.

For arguments sake, let’s assume that, objectively, the current status quo leans left.

Add the “too conservative” wrong trackers to the “right trackers” and, bingo, you have a voting majority.

Simple arithmetic, right?

So, why did so many pollsters and political pundits fall victim to the right track – wrong track paradox?

Viva la Gridlock!

November 11, 2022

The stock market soared yesterday because…
==============

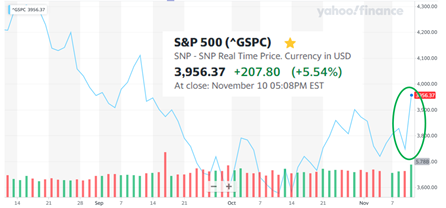
First, the numbers…

Yesterday, the stock market soared … the S&P was up 5.54% to 3,956.

image

Let’s put that number in perspective…

The S&P at 3,956 is:

  • 3% higher than when Biden was inaugurated (01/20/21 S&P = 3,841)
  • 17% lower than the sugar-high market peak (12/27/21 S&P = 4,766)
  • 11% higher than the Biden era market trough (10/12/22 S&P = 3,577)

To summarize, the market today is about where it was when Biden was inaugurated … has recovered about 1/3 of the 25% peak to trough decline … and is up 11% from the trough.

So, you can either feel bad (still down 17% from the peak) … or good (recovered about 1/3 of the peak to trough decline).

=============

For today, let’s focus on the positive … yesterday’s bounce … and ask “why?”

There were 2 near-simultaneous events yesterday morning.

  1. The reported inflation rate for October was down to 7.7%
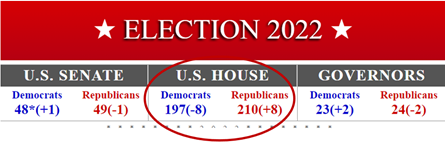
  2. Media vote counting arbiters conceded that the GOP was on track to gain control of the Congress.

image

My take:

The 7.7% is statistically insignificant from the recent inflation running rate … it’s likely month-to-month noise … and likely driven by a decline in residential housing prices … which is, perhaps, a blessing for renters, but a curse to homeowners (whose home is a big chunk of their net worth).

So, I don’t place much weight on the 7.7% inflation rate driving the market gain.

=============

I think the market gain was driven by the near certainty that the GOP will control Congress and we’ll have split government gridlock for the next 2 years … and, at least, an end to reckless government spending.

Here’s hoping…

Election turnout: Gallup nailed it!

November 10, 2022

One chart provides some clues into the election results
===============

The below chart hit my email box early on election day.

image

I glanced at it … then dismissed it as an outlier to the polls and punditry on turnout.

Most said sky high turnout, especially among fed-up Republicans and inflation drained budgeters.

And, the “generic ballot” gave the edge to the GOP

Getting to the point…

==============

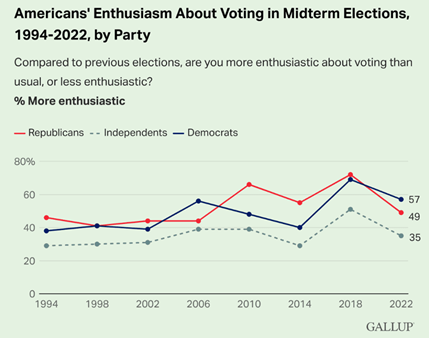
Gallup queried folks on whether they were more or less enthusiastic about voting in the 2022 midterm election compared to prior midterms.

As the above chart illustrates:

In 2010, 2014 and 2018 … GOP voting enthusiasm was very high … and higher than Dem enthusiasm

But, for this year:

  • GOP voting enthusiasm dropped from 72% in 2018 to 49% this year … a whopping 23 percentage point drop.
  • Dem voting enthusiasm also dropped …  from 69% % in 2018 to 57% this year … but, 8 percentage points higher than GOP voting enthusiasm

=============

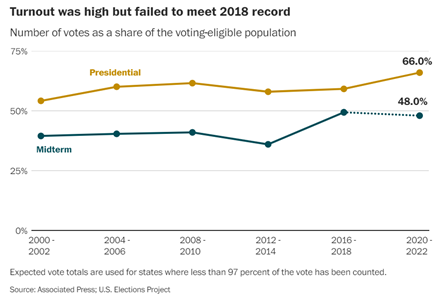
According to an AP / WaPo analysis, turnout (as a percentage of eligible voters) did, in fact, drop this year … down to about 48%

image

And, if the mix conforms to the Gallup voting enthusiasm mix, it suggests that proportionately more Dems were “enthusiastic” and more of them turned out to vote than GOPs.

If the actual turnout numbers confirm that conclusion, it’ll explain a lot about the election results … and, Gallup should get credit for spotting the marker.

Yipes! GOP snaring defeat from the jaws of victory?

November 9, 2022

Hoping for gridlock to stop my IRA bleeding.
=============

I gotta admit, I thought inflation, crime, energy independence and strong borders were a strong hand.

But apparently, not strong enough to win big against abortion, climate control and open borders.

My early morning takeaways:

> So much for the polls, betting markets and political pundits … red wave dissipated somewhere off-shore.

> Kudos to my friends who have already moved to Florida … land of sunshine, low taxes, effective government and common sense.

> Obama got his man …Pennsylvanians should feel so proud.

image

> Laxalt and Johnson should eek out victories to keep the Senate 50-50 … as of 6 a.m.

image

> Best GOP Senate scenario is that Herschel wins a run-off, but that race has a groundhog day feel to it … and a Walker win would crown Romney as the new Manchin (ouch).

> Pundits are still saying that GOP will eek out a Congressional majority and we’ll see legislative gridlock and a stream of entertaining investigation.

> If the pundits are wrong again, my (our) IRAs, 401Ks and 528s are screwed … batten down the hatches, folks ,,, stock up on Chef Boyardee

Yipes!

=============
P.S. Looks like a vindicated Biden against a surging DeSantis in 2024.

The dogs just aren’t eating the dogfood…

November 8, 2022

A left-leaning think tank blisters Dems with a data-rich pre-mortem.
==============

Pre-election, many Dem pundits started lamenting dumb voters (only on the right, of course) and bad messaging … failing to tout touting Biden’s accomplishments and failing to convince the unwashed that climate change and “democracy” are on the ballot, not Biden, inflation, crime or illegal immigration.

That is, until Third Way — a center-left think tank backed by some of the biggest names in Democratic politics — sounded an alarm about deep-seated party flaws. Source

Channeling the Third Way report, Axios outlined the “brutal bill of particulars”.

  • “Democrats are underwater on issues voters name as their highest priorities, including the economy, immigration, and crime.”
  • “While Democrats maintain a lead on handling certain issues like abortion and climate change, voters also rank these issues as lower priorities.”
  • “Voters question whether the party shares essential values like patriotism and the importance of hard work. … Only 43% of voters say Democrats value hard work, compared to 58% for Republicans.”
  • “Even in the areas where Democrats are trusted more [including education], it is not clear that voters are sold on Democrats’ approach or ability to get things done.”
  • Democrats are benefitting from a perception among voters that Republicans are extreme, but…  voters think Democrats are extreme as well.”

=============

Bottom line: Third Way concludes that Democrats are “out of touch on priorities, ideology and values”.

Other than that, how did you like the play Mrs. Lincoln?

==============

P.S. The entire Third Way report — loaded with polling results and analysis — is worth reading.

Key Senate Races: Game Day Bets & Odds

November 8, 2022

Election Day morning…
=============

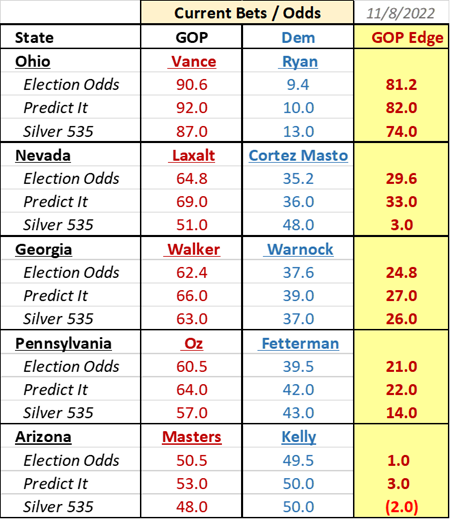
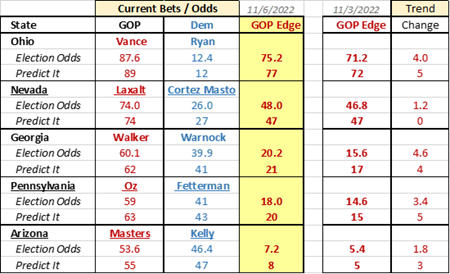
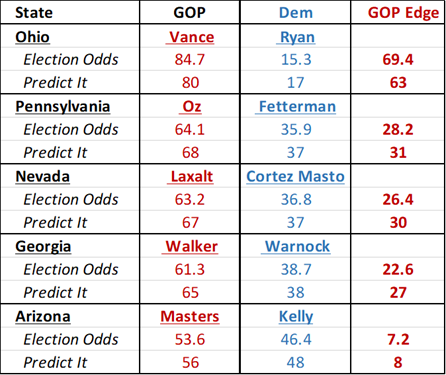
The chart below summarizes what the PredictIt betting market, Election Betting Odds and Silver 535 are saying about the key mid-term Senate races.

Bottom line:

  • Vance is a prohibitive favorite in Ohio
  • All 3 sources agree that Walker is an odds-on favorite in Georgia
  • Silver calls Nevada a toss-up … others call Laxalt an odds-on favorite
  • Silver has Oz a slight favorite in Pennsylvania … others have Oz a stronger odds-on favorite
  • Toss-up in Arizona …Silver has Kelly as a slight favorite … others have Masters a slight favorite … call it a toss-up

It’s Silver against the bets & odds….

image

Key Senate Races: Final-Final Polls

November 8, 2022

What the polls are saying on election morning…
=============

OK, I jumped the gun yesterday when I recapped what I thought were final polls.

A couple of pollsters reported “fresh” polls yesterday and overnight.

So, today — election day — let’s re-recap the major polls: the RCP poll-of-polls, Trafalgar (right-leaning, historically accurate), NYT/Sienna (left-lurching) and, of course, Nate Silver’s 535.

Bottom line:

  • Trafalgar calling all 5 (OH, NV, GA, PA, AZ) for GOP
  • Silver calling AZ for Kelly … other 4 for GOP
  • RCP final: Toss-up in AZ … other 4 for GOP
  • NYT / Sienna on another planet <= no surprise
    ======
  • Runaway for Vance in Ohio
  • Strong lean to Laxalt in Nevada
  • Slight lean to Walker in GA … Kemp’s coattails … UGA football fever – Herschel put the Dawgs on the map!
  • Slight lean to Oz in PA ,,, Silver flipped from lean Fetterman to lean Oz … Oz pitching Biden’s “close all coal plants” blurt
  • Masters close but no cigar in in Arizona … only Trafalgar calling it for Masters … others may be under-estimating Lake’s coattails

image

Key Senate Races: Near-Final Scorecard

November 7, 2022

What the polls are saying…
=============
Yesterday, we recapped the betting markets and odds.

Today — the day before the mid-term elections — let’s recap the major polls: the RCP poll-of-polls, Trafalgar (right-leaning, historically accurate), NYT/Sienna (left-lurching) and, of course, Nate Silver’s 535.

Bottom line:

  • Runaway for Vance in Ohio
  • Strong lean to Laxalt in Nevada
  • Slight lean to Walker in GA (Kemp’s coattails, UGA football is the talk of the state and Hershel’s a UGA football icon)
  • Pollster duel in PA: Trafalgar has Oz up by 2; Silver has Fetterman winning … in rallies Trump drew an overflow of 17,000; Obama only filled half of a 10,000 seat arena
  • Masters close but no cigar in in Arizona

image

Hope & Change?

November 7, 2022

“If you don’t vote for my man, John Fetterman, true democracy will be at risk. It’s a fact”

image

Is this really how Obama wants to be remembered?

A pretty big step-down from “Hope & Change”….

Key Senate Races: Odds & Bets

November 6, 2022

Sunday … 2 days until election.
=============

The chart below summarizes what the PredictIt betting market and Election Betting Odds are saying about the key mid-term Senate races.

Bottom line: A GOP runaway in Ohio … a widening GOP lead in Nevada, approaching runaway status … a statistically significant and widening GOP lead in Georgia, Pennsylvania and Arizona.

image

===============

Specifics from Election Betting Odds

image

image

image

image

image

Still more: Some people just shouldn’t vote!

November 6, 2022

The late humorist Andy Rooney cut to the chase.
===============

Let’s recap…

A couple of days ago, we posted “Some people just shouldn’t vote!” … triggered by a WSJ opinion piece by Peggy Noonan that argued:

If you’re not serious and don’t take our political life seriously … stay home and vote in good conscience next time.

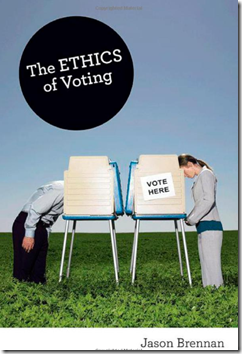
We bolstered Noonan’s piece with an excerpt from GU Prof. Jason Brennan’s book The Ethics of Voting:

All adult citizens have the right to vote … but that they shouldn’t exercise that right unless they are informed, rational, and aiming for the common good.

Yesterday, we posted a contrary point-of-view expressed by former President Obama:

You’ve got to find Cousin Pookie, he’s sitting on the couch right now watching football.

He hasn’t voted in the last 5 elections.

You’ve got to grab him and tell him to go vote.

===============

Let’s consider one more opinion on the subject.

Back in 1984, Andy Rooney — a culture observer & humorist — presented his point-of-view on 60 Minutes.

Rooney’s take on voting:

“If you don’t know anything about anything refrain from voting”

More specifically, Rooney argued:

You hear a lot of talk about getting out the vote these days.

Local politicians are even using government workers to try and register welfare recipients, for example, and several of the big corporations are pretending they’re “Mister Nice Guy” by telling everyone to get out and vote in commercials. .

The companies are trying to sound patriotic and all-American.

Patriotism is selling very well this year. I don’t want to sound un-American or as though I don’t believe in democracy, but I’d prefer to leave a sleeping vote lie.

If someone has a natural inclination not to vote, because he or she isn’t interested, that’s OK with me.

I don’t want my vote cancelled out by some numbskull who hasn’t thought about the issues.

I hate the thought of having anyone dumber than I am vote.

In Russia, more than 90 percent of the people vote.

Does this make Russia a nice country to live in?

In the United States, not many more than half the eligible voters go to the polls in an election year.

That’s OK with me, too.

My advice to you is this: If you don’t know anything about anything, please stay right where you are.

Don’t get out and vote.

Rooney is probably turning over in his grave these days.

===========
P.S. Unfortunately, CBS moved the video clip behind the Paramount+ pay wall … too bad … it’s a classic the way Rooney delivers the message.

More: Some people just shouldn’t vote!

November 5, 2022

Former President Obama begs to differ…
============

Yesterday’s we posted “Some people just shouldn’t vote!” … triggered by a WSJ opinion piece by Peggy Noonan that argued:

If you’re not serious and don’t take our political life seriously … stay home and vote in good conscience next time.

We bolstered Noonan’s piece with an excerpt from GU Prof. Jason Brennan’s book The Ethics of Voting:

All adult citizens have the right to vote … but that they shouldn’t exercise that right unless they are informed, rational, and aiming for the common good.

==============

Well, a couple of loyal readers reminded me of a classic contrary point-of-view on the subject.

Raise your hand if you remember, remember former President Obama “Cousin Pookie” get-out-the vote rally cry.

You’ve got to grab your friends. You’ve got to grab your co-workers.

You know, don’t just get the folks you know are going to vote.

You’ve got to find Cousin Pookie, he’s sitting on the couch right now watching football.

He hasn’t voted in the last 5 elections.

You’ve got to grab him and tell him to go vote.

I didn’t say it … Obama did:

click to view video clip
image

Take that Ms. Noonan…

Remember Scott Brown?

November 5, 2022

John Fetterman sure does!
=============

Flashback to 2010 …

Obama had a filibuster-proof 60-40 Senate.

Then, Teddy Kennedy died, making it 59-40 with a vacancy.

No problem for Obama … quick special election in Dem-heavy Massachusetts would restore 60-40.

But, a stud with a pick-up truck got the GOP nomination. His name: Scott Brown.

Brown had sex-appealing charisma and an aura of “authenticity”.

Did I mention that he was a Republican?

Sure, he talked some about GOP-leaning positions, but his bumper sticker simply read:

Scott Brown #41

Not his jersey number, his potential position a filibuster restorer.

It worked!

image

============

Fast forward to today…

Have you caught any of Fetterman’s brief and “to the point” campaign pitches?

Post-stroke, he has a tough time articulating his policy positions.

That’s probably a good thing since his signature priorities are freeing criminals from prisons and opening public heroin injection sites … neither of which is wildly popular these days.

But, he has a strong plus factor for Biden-loving Democrats:

“I’ll be the 51st Democrat in the Senate”.

As long as he can reliably pull the Senate voting lever, nothing else really matters, does it?

Against all odds, it worked for Scott Brown.

Might work for John Fetterman.

Perish the thought…

Some people just shouldn’t vote!

November 4, 2022

Sounds blasphemous, doesn’t it?
===============

In today’s WSJ, the normally sober-minded Peggy Noonan opined:

If you’re serious and take our political life seriously, please go Tuesday to the polls.

And if not, admit it to yourself and try to become a better citizen so you can vote in good conscience next time.

A provocative thought, Peggy …  but not exactly original.

Let’s do a HomaFiles flashback

==============
First posted Sept. 9, 2012

Every election cycle, I scratch my head and wonder blasphemously whether “one man, one vote” makes sense.

Surveys routinely reveal that a majority of Americans have marginal knowledge of government, politics, and political issues.

Try this: ask folks to explain the difference between the Federal deficit and the Federal debt … ask them where the money that funds, say unemployment benefits, comes from.

Jason Brennan is a rare breed … a libertarian business prof at Georgetown.

His research is at the nexus of ethics and politics.

He wrote an insightful book called The Ethics of Voting that I consider a classic.

image

The essence of Jason’s argument is that all adult citizens have the right to vote … but that they shouldn’t exercise that right unless they are informed, rational, and aiming for the common good.

Let’s drill down on that conclusion…

===============

More specifically, Prof. Brennan argues:

“If a citizen has a right to vote, this means at minimum that she ought to be permitted to vote — no one should stop her or deprive her of the vote — and that her vote must be counted.

However, if citizens do vote, they must vote well, on the basis of sound evidence for what is likely to promote the common good.

That is, in general, they must vote for the common good rather than for narrow self-interest.

Citizens who lack the motive, knowledge, rationality, or ability to vote well should abstain from voting.

Some voters are well informed about what candidates are likely to do.

They know what policies candidates endorse and whether the candidates are sincere.

They know the track records and general trends of different political parties.

Other voters are ignorant of such things.

Another way voters vary is in their degree of rationality .

Some voters are scrupulously rational, while others are irrational.

Some have patently stupid beliefs.

“[Some citizens] are politically engaged, but they are nonetheless often ignorant of or misinformed about the relevant facts or, worse, are simply irrational.

Though they intend to promote the common good, they all too often lack sufficient evidence to justify the policies they advocate.

When they do vote, I argue, they pollute democracy with their votes and make it more likely that we will have to suffer from bad governance.”

* * * * *

Ken’s Take: An interesting perspective that has been constantly on my mind during this election cycle.

At least read the sample chapter … book is available in paperback at Amazon

============

Follow on Twitter @KenHoma

Joe’s giving me an 8.7% raise!

November 3, 2022

And, he rushed to tell me before the mid-term elections.
===============

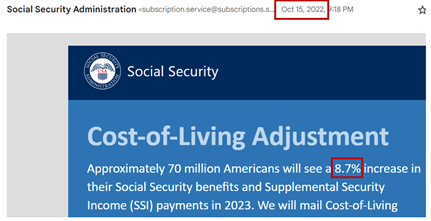
Here’s an email that I got from the Social Security Administration on Oct.15:

image

A couple of takeaways from the email…

  1. The 8.7% COLA (cost of living increase) is the Fed government’s inflation estimate … required to keep SS recipients whole 2023.
  2. The notice was sent to Social Security recipients on October 15.

What’s interesting about the date?

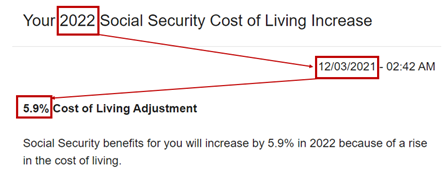
> Last year, we SS recipients were notified of the 2022 cost-of-living increase (5.9%) on December 3, 2021.

image

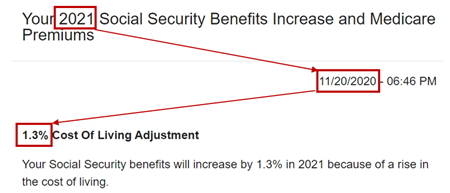
> Two years ago, we SS recipients were notified of the 2021 cost-of-living increase (1.3%) on November 3, 2020.

image

Let’s recap …

> Based on Trump’s last year in office (2020), the inflation-based COL increase for 2021 was 1.7%

> Based on Biden’s first year in office (2021), the inflation-based COL increase for 2022 was 5.9%

> Based on Biden’s 2nd year in office (2022 YTD), the inflation- based COL increase for 2023 is 8.7%.

Ouch.

But, that’s not really new news, right?

What’s more interesting (to me) is the timing of the announcements.

The past years’ practice had been to notify SS recipients of their COLA adjustments (for the next year) in late November or early December.

This year the COLA notification was sent on October 15 … a couple of weeks before the mid-terms.

Coincidence?

Call me skeptical.

I can just envision Biden screaming:

“I protected your Social Security benefits against inflation … and, the Republicans want to take them away.”

That’ll be me screaming when he reads the words from the teleprompter …

==============

We’ve gotta take a told-ya-so lap on this one…

We alerted loyal readers to this probable Biden scam way back on Oct 17, 2022 at 06:45am

Yes, that was me screaming Wed. night…

Key Senate Races: Odds & Bets

November 3, 2022

OK, let’s see what the betting markets are now saying with less than a week to go…

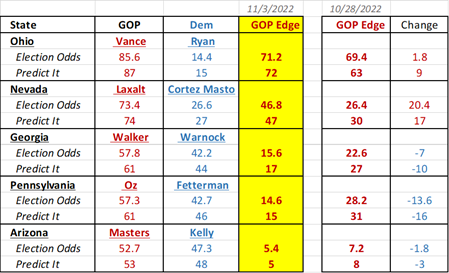
The chart below summarizes what the PredictIt betting market and Election Betting Odds are saying about the key mid-term Senate races.

Bottom line: A GOP runaway in Ohio … a widening GOP lead in Nevada to near-runaway status … statistically significant but narrowing GOP lead in Pennsylvania and Georgia … a toss-up in Arizona.

image

=============

For comparison, here’s what the most favorable Dem-leaning NY Times poll is saying:

image_thumb2[1]

Both can’t be right.

My inclination: Follow the money!

Oct. Update: If the earth is warming, why isn’t Baltimore?

November 1, 2022

I hate to impair a popular narrative with actual data, but…
=============

Like much of the U.S., the Baltimore area (where I live) was enduring an apparent heatwave this summer.

It was hot enough that, even I, momentarily thought: “Maybe the earth really is warming.”

Then, I started looking harder at my monthly electricity bills from BGE (Baltimore Gas & Electric).

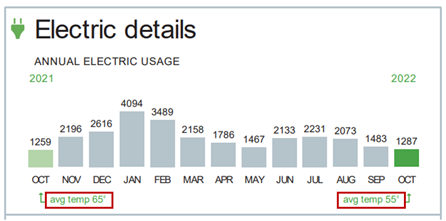
Besides usage info, BGE reports the average monthly temperature, for the current and prior years (the red boxes below).

We previously reported in the past couple of months that year-to-date temperatures in the Baltimore area have been a couple of degrees colder than the prior couple of years.

Well, I just got my October bill and guess what.

The trend is continuing.

image

The average October temperature this year was 55 degrees …  10 degrees colder than last year’s 65 degrees.

Hmm

=============

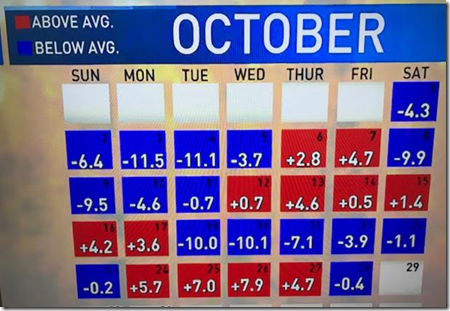
Getting more granular, a local Baltimore TV weather anchor pulled together a daily temperature chart for October.

The bottom line: A majority of days in October were colder than the historical average (aka. “normal”) by an average of 5 degrees; a minority of days were warmer than normal, by an average of 4 degrees

image

Was October a fluke?

=============

Nope.

To dig deeper, I pulled more historical data from my BGE file…

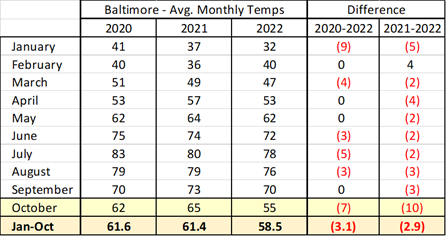
Below are the average monthly temperatures in Baltimore (as reported by BGE) for January to October in years 2020, 2021 and 2022

image

==============

What does the data show?

  • Again, this year (October 2022) was 10 degrees colder than October 2021 … and 7 degrees colder than October 2020
  • More broadly, comparing year-to-year temperature by month, all 2022 monthly temperatures were equal to or colder than 2020 temperatures
  • Compared to 2021, only one month — February 2022 — was hotter than the 2021 temperature (40 degrees to 36 degrees) … all other months in 2022 were colder than their comparable months in 2021.
  • The 10-month average (January to October) for 2020 and 2021 were essentially equal at 61.6 degrees and 61.4 degrees respectively.
  • The 2022 10-month average (January to October) was 2.9 degrees colder in October 2022 than it was in October 2021 …. and 3.1 degrees colder than it was in October 2020.

=============

My take

  • It’s conceivable that BGE’s data collection is wrong … or that Baltimore is a complete outlier that’s not representative of the rest of the earth …. but, I doubt either is true.
  • The data probably doesn’t indicate that the earth is cooling … but, it sure as heck doesn’t support a global warming narrative.

Somebody’s gotta explain to me:

  • If the data shows that my average   local temperatures have dropped about 3 degrees from 2 years ago (and one year ago) — why should I believe (with “settled science certainty”) that the earth will be a degree or two hotter 50 or 100 years from now if I keep driving my SUV?

This circle doesn’t square…

Key Races: Election Odds & Bets

October 31, 2022

As I’ve said before, when I’m looking for near real time, “skin in the game”, quantitative assessment of elections, I go to the PredictIt betting market and, more recently, Election Betting Odds (which tries to incorporate the polls and other information).

The chart below summarizes what they’re saying about the key mid-term Senate races.

Bottom line: A GOP runaway in Ohio … a statistically significant GOP lead in Pennsylvania, Nevada and Georgia … a slight GOP lead in Arizona.

image

=============

P.S. Election Betting Odds has a very cool interactive map … you can hover over a state to see its specific numbers.

=============

Disclosure: Long, long ago, I worked on the business staff of The Daily Princetonian with John Stossel — one of the authors of the Election Betting Odds site

Biden: Gas cost $5 a gallon when I took office…”

October 28, 2022

Not a gaffe, not his dementia … an outright lie!
=============

image
Source

Also in his Syracuse speech this week — like an arsonist who wants credit for calling 911 — he laid claim to bringing gas prices down by over $1.50.

=============

Let’s look at the data…

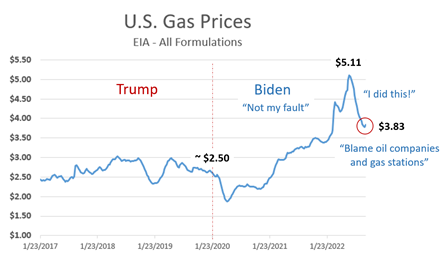
First, the big picture:

image
Data Source: EIA

> Gas prices were about $2.50 per gallon when Trump turned over the keys to Biden.

> At the June 2022 peak — a full 17 months after Biden took office — prices reached $5.11 … more than double the prices when Biden took over.

Classical locker room quip: It all depends where you measure from.

> Prices have come down from the peak … to an apparent bottom at $3.77 … down about 25% from the peak …  but, still about 50% higher than when Biden took office.

Analogy: Binge eater puts on 100 pounds … goes on a diet and loses 50 pounds … touts a 50% weight loss.

> Recently, some statistical “noise” ….prices increased by 1.6% in Sept.  … and, most recently, dropped by about 1.5%

image

Biden’s response to high gas prices: “Blame the profiteering oil companies and gas stations.” Source

C’mon, Joe.

Just take (dis)credit that your your “war on fossil fuels” is working … and stop the BS.

About learning loss and the declining education scores…

October 27, 2022

Anybody remember No Child Left Behind?
=============

Let’s start with what everybody is talking about…

According to The Nation’s Report Card the pandemic school shutdowns took a near catastrophic toll … especially in math.

Pre-Covid, over 42% of 4th graders were considered proficient in math; that percentage slid to  36% during the Covid shut downs.

Similarly, pre-Covid, over 34% of 8th graders were considered proficient in math; that percentage slid to  26% during the Covid shut downs.

All of those numbers are pretty dismal.

=============

I don’t think it’s fair to blame either Trump or Biden for Covid.

While Trump did approve the shutdowns when Covid initially broke out in early 2019 (remember “15 days to stop the spread” ?), he started pushing hard for re-opening in fall 2019 but was stiff-armed by Team Fauci and Team Weingarten.

Biden, though, embraced Fauci and the teacher’s unions’ lockdown position … and, the rest is history.

============

Let’s move the ball forward.

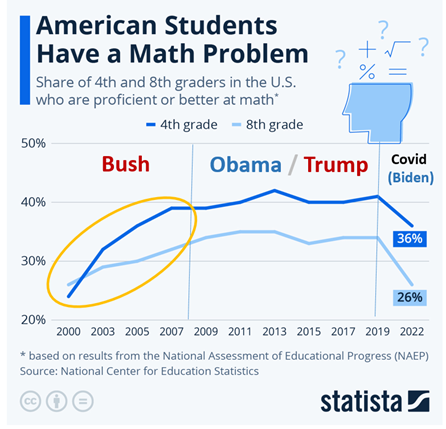
This chart from Statista caught my eye:

image

Note the presidential “eras”.

During the Bush years, students’ math proficiency increased from about 1 in 4 students to about 4 in 10 fourth graders … and 1 out of 3 eighth graders.

Those numbers strike me as pretty dismal … but the trend was right.

During both Obama’s years and Trump’s pre-Covid years, improvements stalled but the gains held.

Then, of course, Covid hit …

=============

Flashback: No Child Left Behind

What I find remarkable about the above chart are the the statistically significant gains during the Bush years …  the result of the much maligned No Student Left Behind (NSLB) educational initiative whose “4 pillars” were:

1. Stronger Accountability for Results
More testing and supplemental services, such as free tutoring to bring students up to speed

2. More Freedom for States and Communities
More local control … allowing districts to use funds for their particular needs, such as hiring new teachers, increasing teacher pay, and improving teacher training and professional development.

3 Proven Education Methods
Putting emphasis on determining which educational programs and practices have been proven effective through rigorous scientific research … with a particular emphasis on reading skills.

4. More Choices for Parents
A
llowing parents to transfer their children (with funding) to better-performing public schools and charter schools.

Critics — especially the national teachers’ unions —  lambasted NCLB for its emphasis on testing, “draconian” accountability focus and ever- threatening “freedom of school choice” … which jeopardized enrollments in under-performing schools.

Hmm.

Sometimes we should follow the data and do what works, right?

The Oz – Fetterman debate …

October 26, 2022

One chart says it all !
=============

You can find lots of commentary re: Fetterman’s disastrous  debate performance…

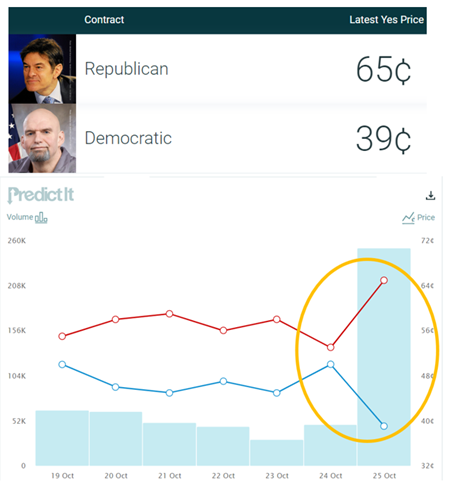
When I’m looking for near instantaneous, “skin in the game”, quantitative calibrating reaction to events, I go to the PredictIt betting market.

Prior to last night’s debate, Oz and Fetterman were roughly tied in the polls and the betting markets.

But, during and immediately after the debate, the odds shifted big time … to Oz 65 – 39.

image


GOP surging in “generic ballot”.

October 24, 2022

Here’s the best explanation that I’ve found.
=============

First, the data…

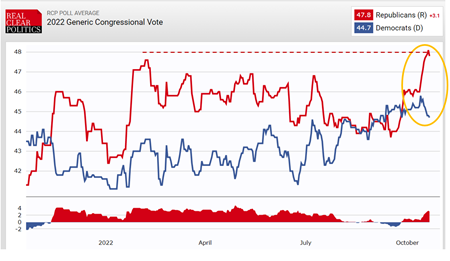
According to the RealClearPolitics poll-of-polls, the most recent weeks have been very, very good for the GOP.

One indicator: the generic congressional ballot which asks: Are you more likely to vote for a Republican or Democrat for Congress?

The GOP held a big lead in the Spring, then the Dems closed the gap after SCOTUS’ Dodds decision.

But, look at the recent GOP surge (the yellow circle below).

image
Source: RCP

What’s going on?

The most most compelling explanation that I’ve come across is from conservative pundit Erick Erickson.

Erickson says:

Having run campaigns, covered campaigns, etc. I’ve observed a thing that happens in wave years.

About 3 weeks out, everything just shifts.

The undecideds begin to break.

They all break the same way.

The media rushes to capture it, which reinforces it.

Specifically, in years of a Republican wave, the media spends most of the time avoiding or downplaying the issues that the GOP is talking about.

Then, one day, the switch flips and those issues are all that anyone talks about.

In the past couple of weeks, CBS, MSNBC, ABC, CNN have all started airing voters who say crime is bad and getting worse.

Voters on CNN in PA are talking about how Fetterman has too many issues for their vote.

MSNBC talked to black voters in Philly overrun with crime.

CBS is talking to voters in AZ who are upset about crime, the economy and the border.

Once the media starts reporting instead of opinionating, the tide starts to roll in.  Source

Makes sense to me…

OMG: Will Romney be taking the mantle from Manchin?

October 20, 2022

A GOP Senate majority may not be bullet-proof.
=============

Another case of the obvious becoming evident …

I was scanning an article on election predictions and was stopped in my tracks by an incidental comment:

RealClearPolitics predicts that Republicans will win five of the seven toss-ups, giving them 52 seats (and a Romney-proof majority).

What did he say?

Oh no, is it possible that Mitt Romney will be the legislative decision-maker for the next 2 years.

Manchin loved the spotlight and did slow some progressive steam-rolling … but when the big money chips were on the table, he caved… e.g. he got totally rolled on the $350 billion climate control bill (nee Inflation Reduction Act).

I’d been assuming that a GOP majority  would gridlock the Senate — something that I consider a good thing. Make that “a very good thing”.

But, much like Manchin couldn’t be counted on, for sure, the GOP can’t count on Romney.

He’ll bask in the  limelight and will position himself as the adult in the Senate …. by siding with the Dems on pivotal issues to demonstrate his bi-partisanship.

Why?

To position himself to compete against Trump (maybe) and DeSantis (certainly) for the GOP presidential nomination in 2024.

Yipes.

From the frying pan into the fire…

Greater threat to the planet: Putin or climate change?

October 19, 2022

Putin is the clear & present danger … so, unleash our oil & gas industry, Joe.
=============

Business leaders are now pushing Biden for an “Energy Marshall Plan” … to mobilize U.S. oil & gas companies for energy independence and export capacity.

Here’s what they’re thinking…

Analytically speaking, risk assessment boils down to a couple of decision criteria:

> How immediate is the threat?

> How severe are the potential consequences?

> How likely are the consequences?

> How might mitigation change the odds?

Applying these risk assessment criteria, the answer to the headlined question is pretty clear (to me).

Putin is demonstrably a clear, present, proven and potentially nuclear danger.

Just turn on your TV to watch the slaughter of innocent people and the destruction of a nation and a culture.

Just listen to Putin threaten to use nuclear weapons.

Putin is maniacal (and probably crazy), determined and has planet-destroying nuclear weapons that he might use if he’s cornered.

And, he’s starting to look cornered.

The climate change threat is murky (sorry, but the science is not close to being settled) and prospective (decades off) … with asserted and uncertain long-term consequences.

Bottom line: If the choice is binary, Putin must be stopped ASAP.

If the Putin and climate threats need to be “balanced”, then the scale should be tilted to stopping Putin.

Putin is clearly the more immediate threat.

Climate control can wait.

Let’s drill down on the decision criteria…

=============

THREAT ASSESSMENT

Immediacy 

The Putin threat is happening now.  Just turn on your TV right and watch the slaughter of innocent people and the destruction of a nation and a culture.

Even climate control zealots concede that its potential “existential threat” from climate change is decades away.

=============

Severity

Climate control zealots say that, unchecked by draconian mitigation, the planet will be a degree or two warmer in 50 years … and that’s enough to end life as we know it.

Let’s assume that’s true.

Some might argue that the Putin threat is localized and contained.

The Ukraine invasion is tragic and sad, but c’mon man, it’s just Ukraine.

Once Putin gets to the Polish border, the U.N. and NATO will stop him in his tracks.

Might be true.

But, what if Putin is, in fact, crazy and, when cornered, he starts lobbing nukes.

Suddenly, we’re looking at a level of global destruction that gives climate change a run for its money.

==============

Likelihood

So, what is the likelihood that climate change puts planetary existence at risk?

Sure, clean energy beats dirty energy and a green mindset makes sense.

But, the case for climate change ending the planet’s existence is a reach.

It is disputable whether the “data is clear” and that “the science is settled” on the consequences of climate change.

For details, see 16 Reasons why I’m lukewarm on climate change

Personally, I’d score the likelihood of Putin unleashing planet-destroying nukes higher than a climate existential threat.

=============

Mitigation

This is where things get dicey.

I’m confident that the U.S. will become increasingly green.

That’s a good thing.

I believe that American ingenuity and technology will — sometime and somehow over the next 50 years — provide game-changing climate control remedies.

But, as Igor Sechin, CEO of Russia’s state-owned Rosneft, has warned

Some ecologists and politicians urge for a hasty energy transition, yet it requires an unrealistically fast launch of renewable energy sources and faces issues with storage, ensuring reliability and stability of power generation. WSJ

And, to this point, climate control initiatives in the U.S. and Europe have largely been virtue signaling … outsourcing fossil fuel production to other countries (most notably Russia!) … putting the U.S. and Europe in a vulnerable security position.

Question: Is Russian oil cleaner than U.S. or Canadian oil?

Answer: Nope!

So, the pivotal question is how to “mitigate” the Putin threat.

Well, maybe Putin can be jawboned and shunned … and will come to his senses and rein in  his destructive tendencies.

My opinion: Odds of that are essentially zero.

Maybe the rational Russian people will rise up and take him out.

I’m betting the under on that one, too

Let’s try diplomacy.

How’s then been working out?

Not to worry, NATO will ultimately use military force to contain the Putin risk at the Polish border.

English translation: NATO nations will encourage the U.S. to kick Putin’s ass when the time comes

Military containment might be doable … but, at a high cost with the incumbent risk that a crazy Putin starts a nuclear war.

=============

So what to do?

Oh yeah, there are other Putin-mitigating options.

How about draining his war-mongering financial resources with sanctions?

In logic-speak: necessary but not sufficient … especially since the current sanctions explicitly rule out any transactions related to the flow of Russian oil.

According to Biden’s Deputy National Security Advisor Daleep Singh:

“To be clear, our sanctions are not designed to cause any disruption to the current flow of energy from Russia to the world” Source

Say, what?

Bottom line: The only non-military way to cripple Putin’s war mongering is to use U.S. oil & gas production as a geo-political strategic tool … the geo-political strategic tool!

As one right-leaning pundit puts it:

Putin’s power comes from money, most of Putin’s money comes from oil and gas.

It stands to reason that if you’re trying to punish him, hitting him in the wallet is the most effective way to do it.

So why would our President specifically exempt what is the best, most effective, and really only significant way to hurt Putin in way that might impact his behavior?

Of course, there’s an explanation…

Biden is boxed by his party’s far left climate control zealots.

Nonetheless, as we’ve said before:

It’s time to reprioritize energy security and independence by unleashing U.S. oil & gas production!

He has to do an objective risk assessment (see above), stiff-arm his parity’s uber-left loons, restore U.S. energy superiority by unleashing our oil & gas industry.

It’s as simple as that!


Joe’s giving me an 8.7% raise!

October 17, 2022

And, he rushed to tell me before the mid-term elections.
===============

Here’s an email that I got from the Social Security Administration over the weekend:

image

A couple of takeaways from the email…

  1. The 8.7% COLA (cost of living increase) is the Fed government’s inflation estimate … required to keep SS recipients whole 2023.
  2. The notice was sent to Social Security recipients on October 15.

What’s interesting about the date?

> Last year, we SS recipients were notified of the 2022 cost-of-living increase (5.9%) on December 3, 2021.

image

> Two years ago, we SS recipients were notified of the 2021 cost-of-living increase (1.3%) on November 3, 2020.

image

Let’s recap …

> Based on Trump’s last year in office (2020), the inflation-based COL increase for 2021 was 1.7%

> Based on Biden’s first year in office (2021), the inflation-based COL increase for 2022 was 5.9%

> Based on Biden’s 2nd year in office (2022 YTD), the inflation- based COL increase for 2023 is 8.7%.

Ouch.

But, that’s not really new news, right?

What’s more interesting (to me) is the timing of the announcements.

The past years’ practice had been to notify SS recipients of their COLA adjustments (for the next year) in late November or early December.

This year the COLA notification was sent on October 15 … a couple of weeks before the mid-terms.

Coincidence?

Call me skeptical.

I can just envision Biden screaming:

“I protected your Social Security benefits against inflation … and, the Republicans want to take them away.”

That’ll be me screaming when he reads the words from the teleprompter …

Why does inflation feels so much worse than 8%?

October 14, 2022

Since Biden was inaugurated consumer prices have increased by over 13% … more in key consumer categories
==============

Following the stats communications principle of “bite sizing” large numbers into smaller (less alarming) ones, Biden likes to focus on month to month price changes.

Along the same vein, the BLS and media norm is to focus on year-over-year percentage increases.

For example, the latest CPI increase is reported at 8.2%

But, when we go to a store or a gas station, prices seem so much worse.

Why is that?

Simple answer: the headlines aren’t reporting the most relevant numbers — price levels and their change from a meaningful starting point.

A more complicated statistical answer has to do with the “miracle of compounding” … which in the case of prices, is more like the “disastrous effect of compounding”

Case in point: this week, the BLS reported that, in Sept. 2022, the CPI increased 8.2% from Sept. 2021.

Let’s set a different comparative point — namely, January 2021 — when Trump turned over the WH keys to Biden…

in January 2021, the CPI was 261.6 … in Sept. 2022, it was 296.8 … that’s an increase of 13.1% …  which is 1.6 times 8.1% (i.e. 60% higher)

That’s what people are feeling … not the year ago comparison … since the year ago number already has some jaw-dropping inflation baked in.

In stats-speak, this is the “lapping principle” 

And, as the chart below shows, the price tag pain is worse for the most relevant home budget items.

For example, since Biden’s inauguration…

  • Food at Home is up 17.7%
  • Gas is up 58.6%
  • Electricity is up 23.3%
  • Natural gas is up 51.8%
  • Used cars are up 36.2%
  • Housing costs are up almost 10%
  • Air fares are up 41.8%

click table  to enlarge
image

The red  numbers above show what consumers are feeling … not “just” the 8.2%.

==============

Chart notes:

  1. Columns (a) and (b) are from the published BLS reports for January 2021 and September 2022
  2. Column (c) “Point to Point % Increase” is the % increase from Jan.2021 to Sept. 2022
  3. Column (d) “Compound Annual Rate” is the   is the annualized percentage increase from Jan. 2021 to Sept. 2022
  4. Column (e) is the percentage change from Sept. 2021 to Sept. 2022

Again, IMHO, column (c) “Point to Point % Increase” from Jan.2021 to Sept. 2022 are the numbers that we should all be focusing on.